The buttons below each open an example of how LISN has been, or can be, used.
Dani's testimonial
Spiritual, not religious
‘RELIGIOUS REFUGEE’
Adam has been hurt from his experience of being suppressed in a fundamentalist religious environment. He wanted to find local friendship of people who, like him, care deeply about their souls, but do not want to be told by others how to do that.

When Adam found LISN as a guest, he was able to experiment, with the words and meaning for spirituality that worked for him individually. He found that defining his own terms and meanings was rewarding and encouraging and so he registered as a member of LISN, where he found a mapping feature. On the mapping he discovered people and groups who were at a similar season in their spiritual journey and
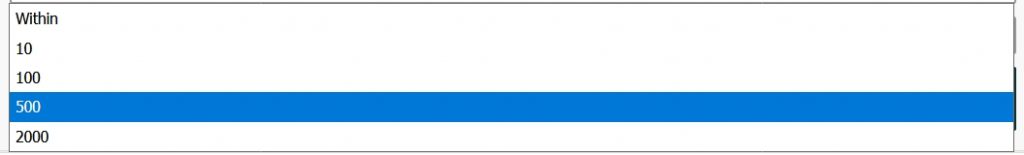
1 They were near where he lived (within a defined distance)
2 they had a similar outlook and background and were able to help him feel a sense of belonging.
As a result Adam is now part of a group of spiritual friends whose open conversations allow him to explore questions he always wanted to, and he is delighted with how freedom has allowed new explorations into relationship and his own sense of self-worth.
Emotional Needs
Connection and Support for the soul
Annabel has been through a stage of significant loss. A member of one of the ‘big 5’ religions, she and Joe, her husband, were staunch members of their  congregation. However the death of both her mother and her daughter led her to look for a different level of connection to what she gained from her weekend religious activities. Through LISN membership Annabel found inspiration from others who have had similar losses, and who were nearby.
Some time later Annabel searched for spirit groups in her area and found to her delight that the ones which appeared offered grief support, one was government run, and one was based in a religious environment she felt comfortable with. After attending both groups she and Joe discovered that their experience had led them to pay forward the compassion they received, so they set up a group of their own and others soon joined them and were cared for by them.
Annabel still does not understand how LISN was able to filter people and groups to match her own personal needs, as she did not have to fill out a form describing what she wanted. All she did was respond to her own definitions of where she was at on the LISN website.
Family relationships
Connecting across the age gap
Steve and Karen have three kids who are teenagers. They want their children to think about more than social media but have had trouble connecting with language that unites them. After working through their own definitions using LISNlanguage, they shared their terms with their children.
The teenagers liked the interactive cellphone paths to understanding what they themselves believed – and the sharing of different viewpoints led to new communication paths between them and their parents.
As a result, Steve and Karen became more open to dialog with others, including their children’s friends. This expanded into an inter-faith dialogue after they changed their LISN definitions to reflect new preferences to be contacted by a wider range of people than their traditions would have allowed. One couple befriended through LISN are refugees recently arrived from Somalia. Other couples also became friends and Steve and Karen were encouraged to create a new group that reaches out to newcomers to their neighbourhood.
To their surprise, their own children resonated with their new found openness and joined their group. They have lots of laughter when they communicate in their own LISNlanguage of the spirit.
Lone Spirit
Longing for spiritual understanding
 Ethelia is lonely, new to her new village, and with specific spiritual interests which could be called ‘mystic’. Her country does not permit views contrary to the national religion. Ethelia longs for people to explore questions and inspiration with, and finds LISN.
LISN offers Ethelia the chance to define her own spirit language, and in doing so she also discovered others in her country who are of a like heart. She is able to form friendships and starts to offer poetry to LISN from her own soul. After moderation her work is accepted and is part of LISN. Friendships blossom from this and soon she feels a freedom she wanted to chat with people across the world about her questions and experiences.
Ethelia’s poetry is safe on LISN, because no online commenting is allowed and she is able to remain anonymous. Still, people who like her work appear in the searches she does, and she likes that they have been encouraged by her art. Her spirit feels it now has connection and belonging across the world, and that she is ‘heard’
Ethelia then discovered that her contributions to LISN poetry can be ‘translated’ if she chooses, into the language of the reader, using the words and definitions that the reader has defined. She likes that idea, and gives LISN permission to publish her work in that form.
Dominated by belief
Wanting to be free to listen to inner voice
Frederick has been told what to believe his whole life. He found on LISN a place where he can define his own views without anyone else knowing what they are. He likes that.
After some months of following the inspiring learning tracks (which do not have religious teachings in them) Frederick finds the confidence to reach out to others. Whe he searches for friends he finds, to his amazement, that LISN has filtered possible friends who seem just like him, though he does not know how LISN did it, since his work on the site is confidential and not released.
Religious Leader
improved membership and group participation
A more detailed explanation is available here.
Father Chris, a priest/imam/rabbi had a look at LISN and loved it.  He joined LISN and then discovered he can also upload his entire cohort of parishioners as users, so that they are part of the membership of LISN, but specifically assigned to his care group.
Now his organization members can login and maintain their small groups online, while keeping informed and involved. New people from outside his groups are joining by resonating with people within his group and Father Chris is really pleased about that.
Spiritual not Religious
Forming a non-affiliated group
Catherine is one of the 25% of North Americans who categorize themselves as ‘spiritual not religious’.
She wants to expand her small group and found that LISN worked for her. After becoming a member and registering and profiling her small group, she was befriended by two local families who were searching for what she offered. All love the ability to find local resonance. Catherine loves that without cost she is able to have a group forum online for her group members.
Interested in knowing more about how spiritual people gather in today’s fast paced world? how-we-gather is a PDF that describes millennials deepening community in new ways across America.
Religious structure
saving money and improving services
Archbishop Clancy wanted some way of knowing who was in his diocese, and how they were grouped.  He had recently found a number of small groups existed that he did not know about. His attempts to get people to let him know had not worked, probably because things were constantly changing and there was no online method for people to update their own connections.
Then Clancy found LISN, and by asking each congregation to upload and involve their members to update their own profiles and association with small groups he is now able to see growth in spiritual development he had not even been aware of.
Then new people started to come out of the blue from outside his religious boundaries!!
Corporate membership
Value for those organizations who want to move to membership empowerment
Beth wanted to find a spiritual director.  She looked online and found lots of offerings but no indication if they would match what she was looking for. By registering and defining membership with LISN she was able to define her own spiritual expectations in a fun way, and in doing so the list of local Spiritual Directors was somehow narrowed down to those who matched her needs and style. She loved not having to research a whole lot of options and found it easy to choose one that works well with her spirit.
Every organization offering spiritual services can benefit from the LISN front end.
LISN allows organizational control to remain with the organization, yet offers a global perspective that anyone can join at the same time. How?
The key to the LISN strategic membership platform is the ability to create memberships that are private subsets of a bigger whole. We are all human, so LISN starts there. If you have no other affiliation you can still join. However if you are part of an organization such as a service provider, your membership can be accessed securely and separately. This applies to a religious structure such as Christian or Buddhist, as well as specific non-affiliated or multi-faith spiritual organizations such as Spiritual Directors International. When you log in as a member, you get the choice to decide which of the groups you belong to you wish to work with during that session. You may select a private meditation group you have joined. You may select your local congregation or temple community. You may select the organizational structure you are a service provider for (eg SDI), or you may just want to look for people from a particular religion that you are affiliated with.
In the case of a service provider, the level of membership will determine what you are entitled to see and do.
Of course all members have their own personal dashboard. However membership has multiple levels.
Here are some examples of membership levels:
A group admin for a service provider will be able to structure country, region and specific groups, upload and manage memberships.
A specific service member will be able to access all the people who are connected to them, either individually, or in an affiliated group. The service member can then contact their clients via LISNchat or post information (eg upcoming vacation times, or a pending retreat) onto the group forum which is available (optional)
From a group administrator perspective, logging into the sub-domain for the service group (E.g. sdi.linkedinspirit.net) automatically provides a private network environment for the SDI group and all its sub-groups and members.
Secure and private access to this group is provided with all the LISN search features, inspiration, profiling etc, without having to develop these specifically for that one organization.
What is even more important, however, is that because any other individuals can become members of LISN, they can register, request friendship with a service provider (e.g. a spiritual director) and filter as per Beth’s example above!
Once connected to any individual, the ability to be recommended or referred for friendship is automatic.
Guests can come onto LISN and find matching service providers without having to be limited to a specific organization. While this may sound negative, it is in fact a positive for the enquirer, and will in the long run demonstrate the service strengths of any provider.
LISN recommends that you have a good look at the upcoming developments for surveys, spiritual analysis, mapping etc. These features and benefits can be applied to the subset of data that applies to you, your service providers and all the clients that are affiliated to them!
Best of all, LISN is not for profit, and seeks to provide a service to all spiritual ventures at cost.


 becomes:


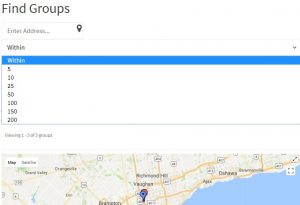
 LISN also has mapping and organizational support for small groups, circles, councils. LISN can link a person to spiritual circles or groups who are local or in a vicinity of interest.


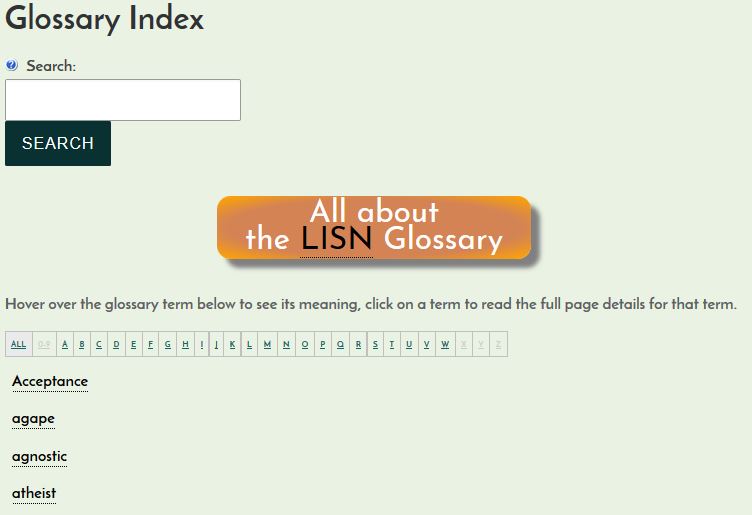
 The content of LISN is kept in pages of information, which are categorized according to content. You can find such pages filtered by category, by selecting the LISN category from the side bar drop-down list. You can find Interactive Question Surveys (IQS) is a category.
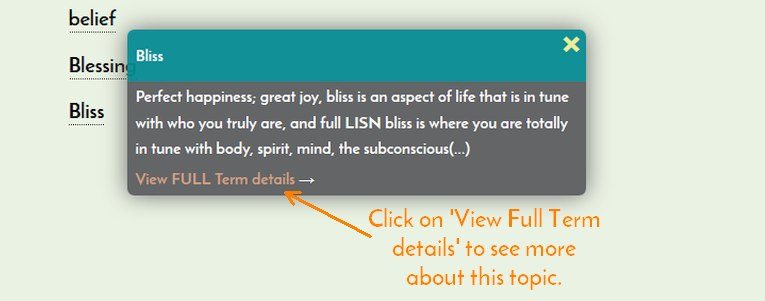
 Click here to go to the glossary and learn more.

 or enter your search address for where you are.